This function visualizes the impact of normalization on the data
Usage
norm_plot(
  original,
  normalized,
  type = "box",
  text_size = 10,
  palette = "viridis",
  save = FALSE,
  file_path = NULL,
  file_name = "Norm_plot",
  file_type = "pdf",
  dpi = 80,
  plot_width = 10,
  plot_height = 7
)
Arguments
- original
A
raw_dfobject (output ofcreate_df) containing missing values, or animp_dfobject after imputing the missing values withimpute_na.- normalized
A
norm_dfobject after normalizing the data frame provided asoriginalusingnormalize_data.- type
Type of plot to generate. Choices are "box" or "density." Default is
"box."- text_size
Text size for plot labels, axis labels etc. Default is
10.- palette
Viridis color palette option for plots. Default is
"viridis". Seeviridisfor available options.- save
Logical. If
TRUEsaves a copy of the plot in the directory provided infile_path.- file_path
A string containing the directory path to save the file.
- file_name
File name to save the plot. Default is
"Norm_plot."- file_type
File type to save the plot. Default is
"pdf".- dpi
Plot resolution. Default is
80.- plot_width
Width of the plot. Default is
10.- plot_height
Height of the plot. Default is
7.
Details
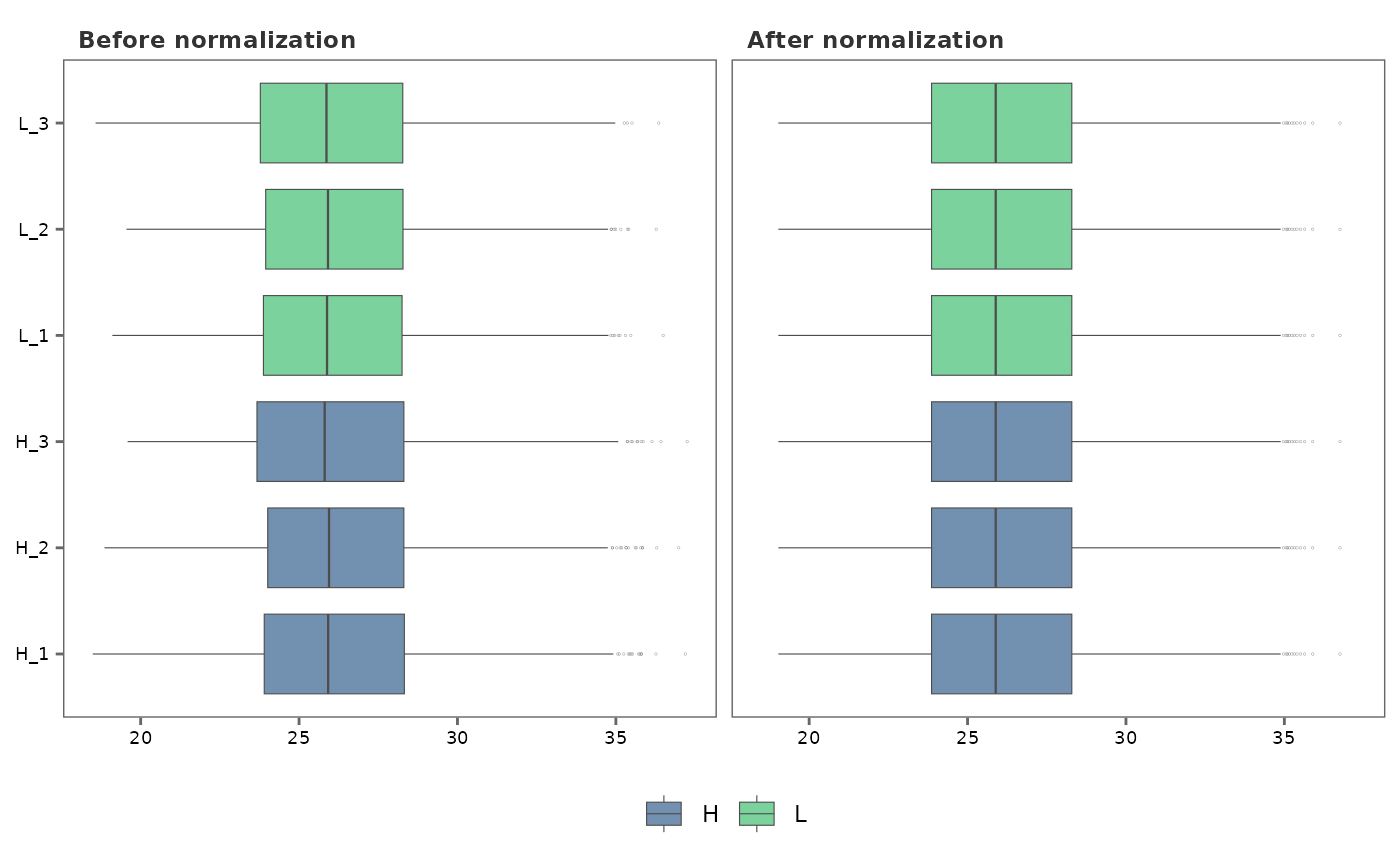
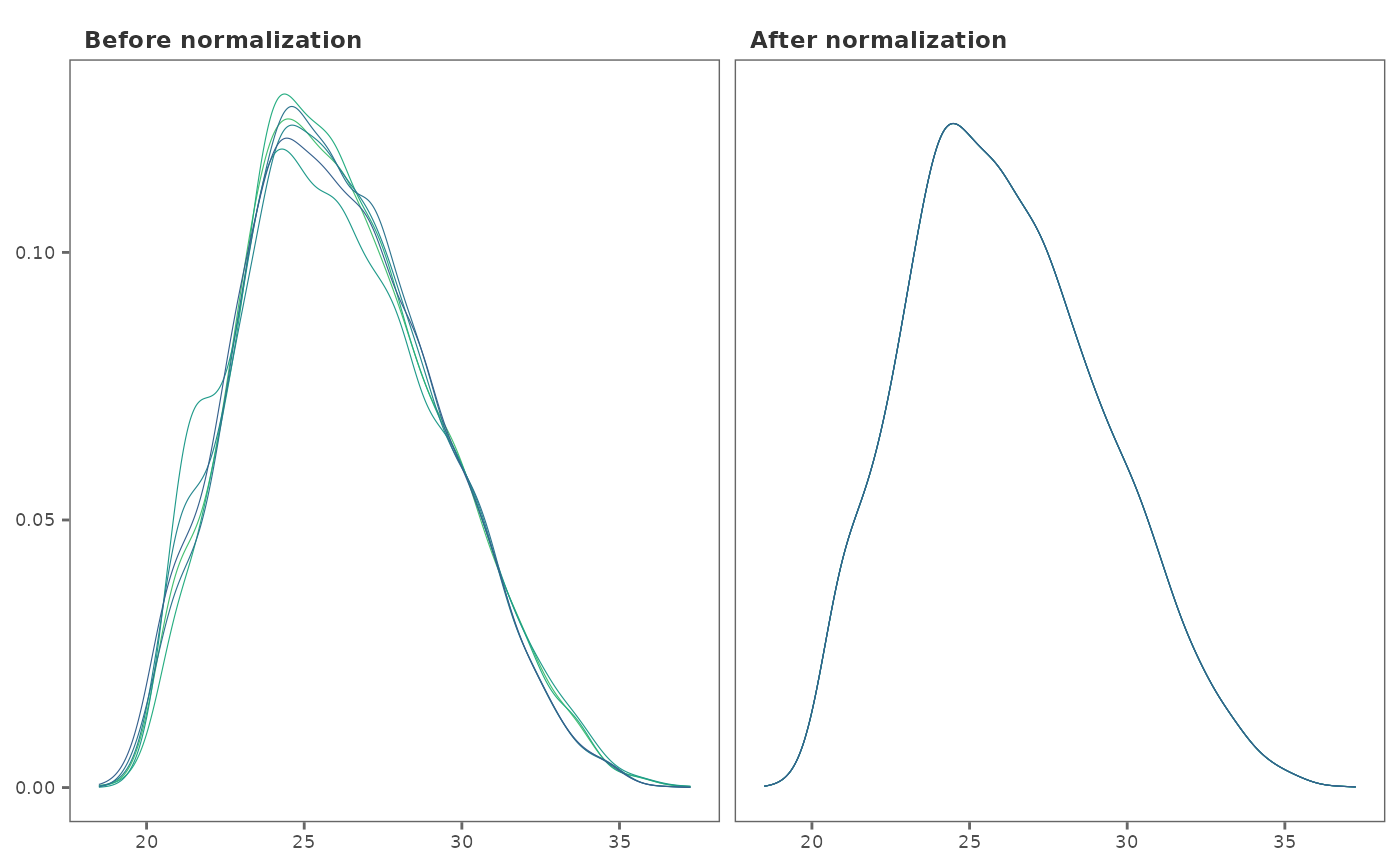
Given two data frames, one with data prior to normalization
(original), and the other, after normalization (normalized),
norm_plot generates side-by-side plots to visualize the effect of
normalization on the protein intensity data.
Examples
# \donttest{
## Generate a raw_df object with default settings. No technical replicates.
raw_df <- create_df(
prot_groups = "https://raw.githubusercontent.com/caranathunge/promor_example_data/main/pg1.txt",
exp_design = "https://raw.githubusercontent.com/caranathunge/promor_example_data/main/ed1.txt"
)
#> 0 empty row(s) removed.
#> 0 empty column(s) removed.
#> 80 protein(s) (rows) only identified by site removed.
#> 65 reverse protein(s) (rows) removed.
#> 42 protein potential contaminant(s) (rows) removed.
#> 1923 protein(s) identified by 2 or fewer unique peptides removed.
#> Zeros have been replaced with NAs.
#> Data have been log-transformed.
## Impute missing values in the data frame using the default minProb
## method.
imp_df <- impute_na(raw_df)
## Normalize the imp_df object using the default quantile method
norm_df <- normalize_data(imp_df)
## Visualize normalization using box plots
norm_plot(original = imp_df, normalized = norm_df)
#> Warning: argument is not numeric or logical: returning NA
#> Warning: argument is not numeric or logical: returning NA
#> Warning: argument is not numeric or logical: returning NA
#> Warning: argument is not numeric or logical: returning NA
#> Warning: argument is not numeric or logical: returning NA
#> Warning: argument is not numeric or logical: returning NA
 ## Visualize normalization using density plots
norm_plot(imp_df, norm_df, type = "density")
## Visualize normalization using density plots
norm_plot(imp_df, norm_df, type = "density")
 # }
# }