This function visualizes protein intensity differences among conditions (classes) using box plots or density distribution plots.
Usage
feature_plot(
  model_df,
  type = "box",
  text_size = 10,
  palette = "viridis",
  n_row,
  n_col,
  save = FALSE,
  file_path = NULL,
  file_name = "Feature_plot",
  file_type = "pdf",
  dpi = 80,
  plot_width = 7,
  plot_height = 7
)
Arguments
- model_df
A
model_dfobject from performingpre_process.- type
Type of plot to generate. Choices are "box" or "density." Default is
"box."- text_size
Text size for plot labels, axis labels etc. Default is
10.- palette
Viridis color palette option for plots. Default is
"viridis". Seeviridisfor available options.- n_row
Number of rows to print the plots.
- n_col
Number of columns to print the plots.
- save
Logical. If
TRUEsaves a copy of the plot in the directory provided infile_path.- file_path
A string containing the directory path to save the file.
- file_name
File name to save the plot. Default is
"Feature_plot."- file_type
File type to save the plot. Default is
"pdf".- dpi
Plot resolution. Default is
80.- plot_width
Width of the plot. Default is
7.- plot_height
Height of the plot. Default is
7.
Details
This function visualizes condition-wise differences in protein intensity using boxplots and/or density plots.
Examples
## Create a model_df object with default settings.
covid_model_df <- pre_process(covid_fit_df, covid_norm_df)
#> Total number of differentially expressed proteins (8) is less than n_top.
#> None of the proteins show high pair-wise correlation.
#>
#> No highly correlated proteins to be removed.
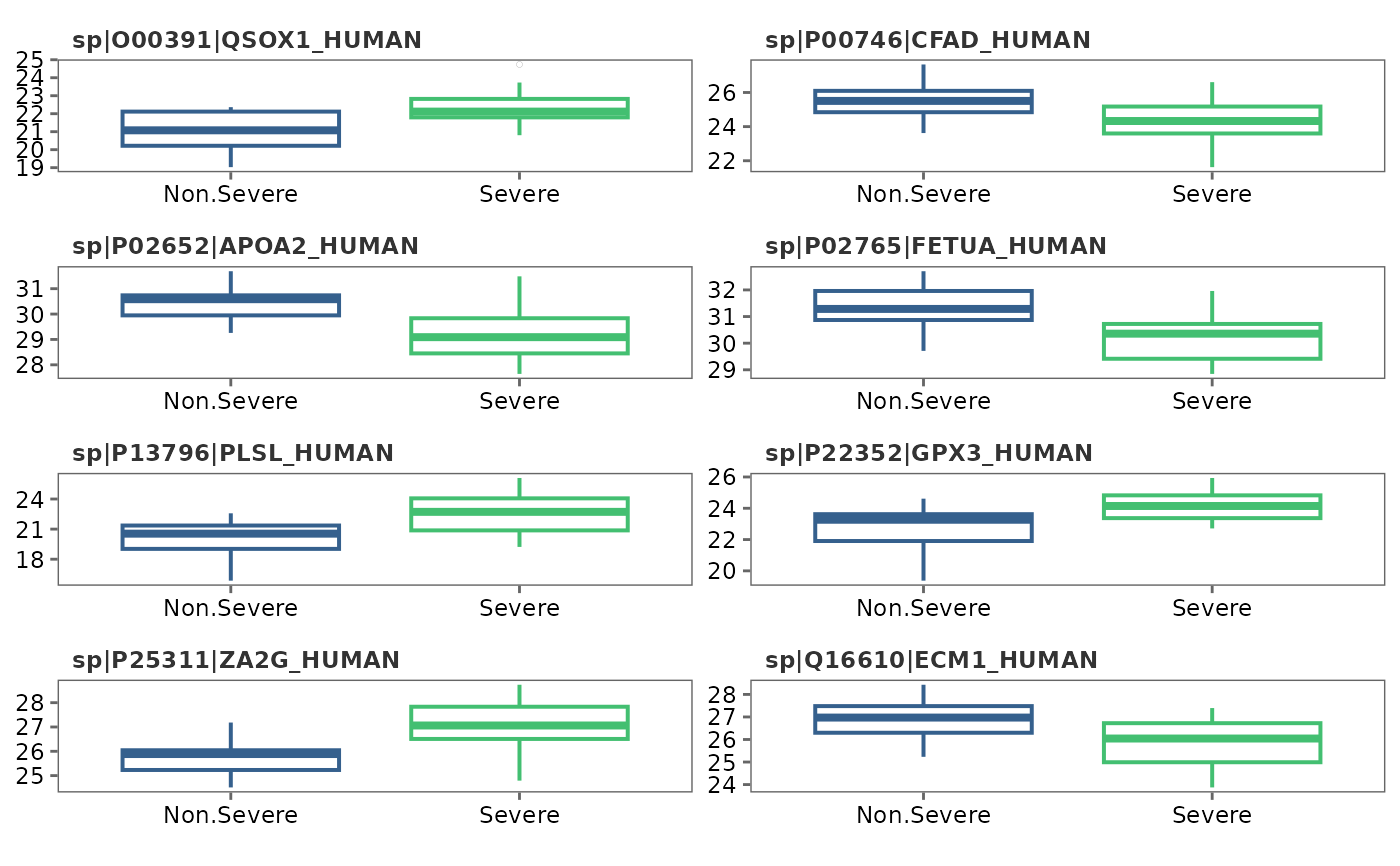
## Feature variation - box plots
feature_plot(covid_model_df, type = "box", n_row = 4, n_col = 2)
#> Using condition as id variables
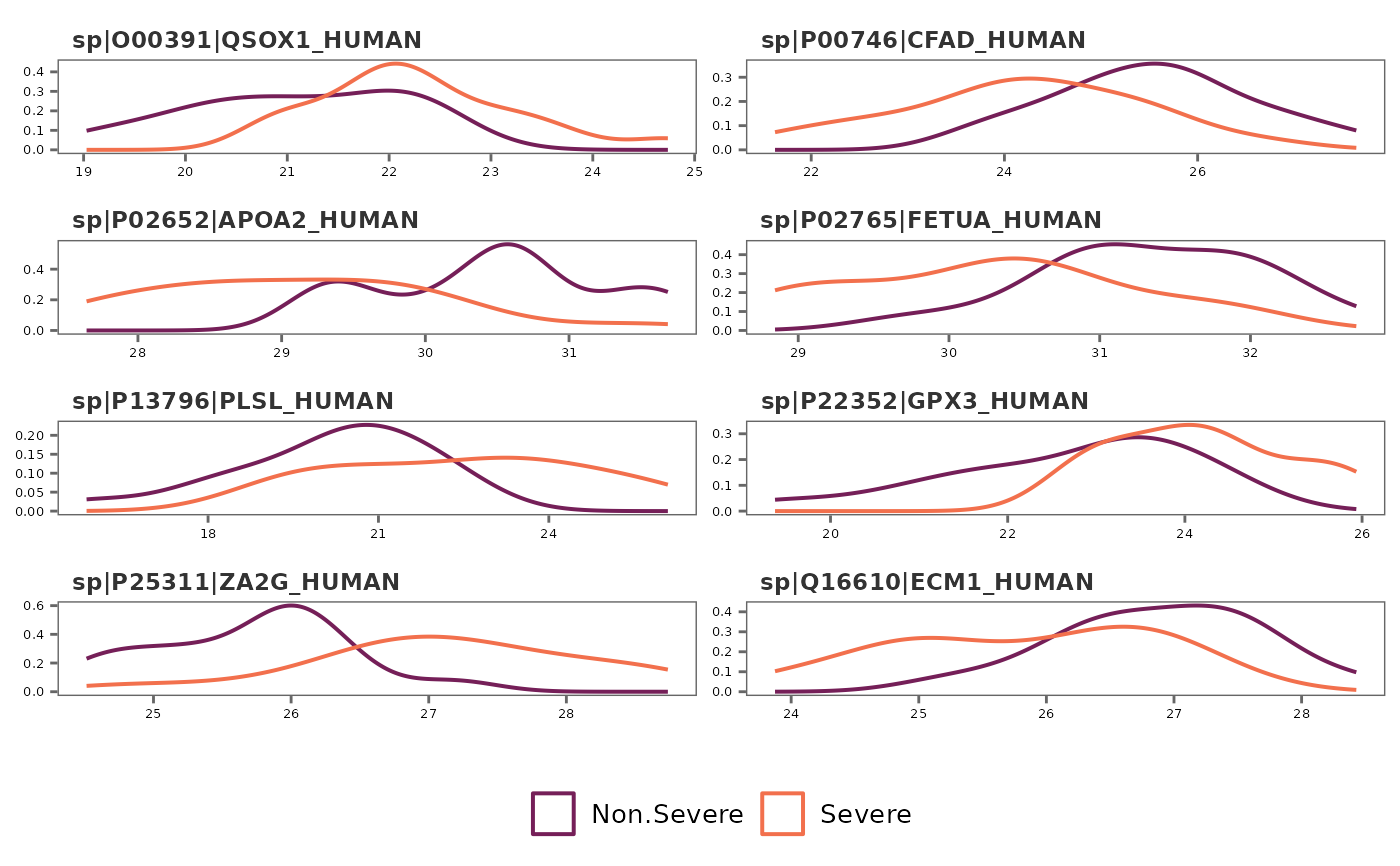
 ## Density plots
feature_plot(covid_model_df, type = "density")
#> Using condition as id variables
## Density plots
feature_plot(covid_model_df, type = "density")
#> Using condition as id variables
 ## Change color palette
feature_plot(covid_model_df, type = "density", n_row = 4, n_col = 2, palette = "rocket")
#> Using condition as id variables
## Change color palette
feature_plot(covid_model_df, type = "density", n_row = 4, n_col = 2, palette = "rocket")
#> Using condition as id variables