This function generates density plots to visualize the impact of missing data imputation on the data.
Usage
impute_plot(
  original,
  imputed,
  global = TRUE,
  text_size = 10,
  palette = "viridis",
  n_row,
  n_col,
  save = FALSE,
  file_path = NULL,
  file_name = "Impute_plot",
  file_type = "pdf",
  plot_width = 7,
  plot_height = 7,
  dpi = 80
)
Arguments
- original
A
raw_dfobject (output ofcreate_df) containing missing values or anorm_dfobject containing normalized protein intensity data.- imputed
An
imp_dfobject obtained from runningimpute_naon the same data frame provided asoriginal.- global
Logical. If
TRUE(default), a global density plot is produced. IfFALSE, sample-wise density plots are produced.- text_size
Text size for plot labels, axis labels etc. Default is
10.- palette
Viridis color palette option for plots. Default is
"viridis". Seeviridisfor available options.- n_row
Used if
global = FALSEto indicate the number of rows to print the plots.- n_col
Used if
global = FALSEto indicate the number of columns to print the plots.- save
Logical. If
TRUEsaves a copy of the plot in the directory provided infile_path.- file_path
A string containing the directory path to save the file.
- file_name
File name to save the density plot/s. Default is
"Impute_plot."- file_type
File type to save the density plot/s. Default is
"pdf".- plot_width
Width of the plot. Default is
7.- plot_height
Height of the plot. Default is
7.- dpi
Plot resolution. Default is
80.
Details
Note, when sample-wise option is selected (
global = FALSE),n_colandn_rowcan be used to specify the number of columns and rows to print the plots.If you choose to specify
n_rowandn_col, make sure thatn_row*n_colmatches the total number of samples in the data frame.
Examples
## Generate a raw_df object with default settings. No technical replicates.
raw_df <- create_df(
prot_groups = "https://raw.githubusercontent.com/caranathunge/promor_example_data/main/pg1.txt",
exp_design = "https://raw.githubusercontent.com/caranathunge/promor_example_data/main/ed1.txt"
)
#> 0 empty row(s) removed.
#> 0 empty column(s) removed.
#> 80 protein(s) (rows) only identified by site removed.
#> 65 reverse protein(s) (rows) removed.
#> 42 protein potential contaminant(s) (rows) removed.
#> 1923 protein(s) identified by 2 or fewer unique peptides removed.
#> Zeros have been replaced with NAs.
#> Data have been log-transformed.
## Impute missing values in the data frame using the default minProb
## method.
imp_df <- impute_na(raw_df)
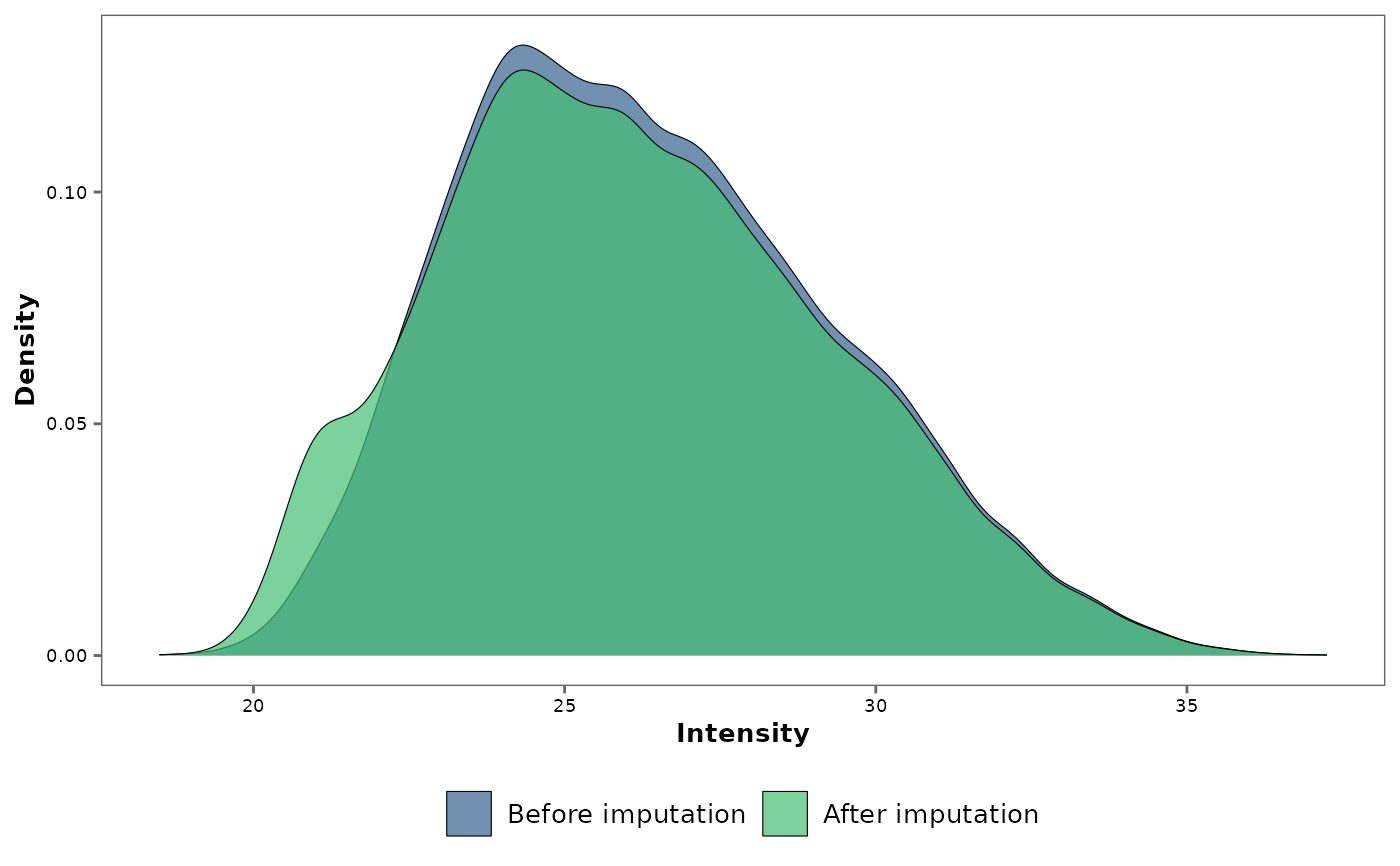
## Visualize the impact of missing data imputation with a global density
## plot.
impute_plot(original = raw_df, imputed = imp_df)
#> Warning: Removed 1084 rows containing non-finite outside the scale range
#> (`stat_density()`).
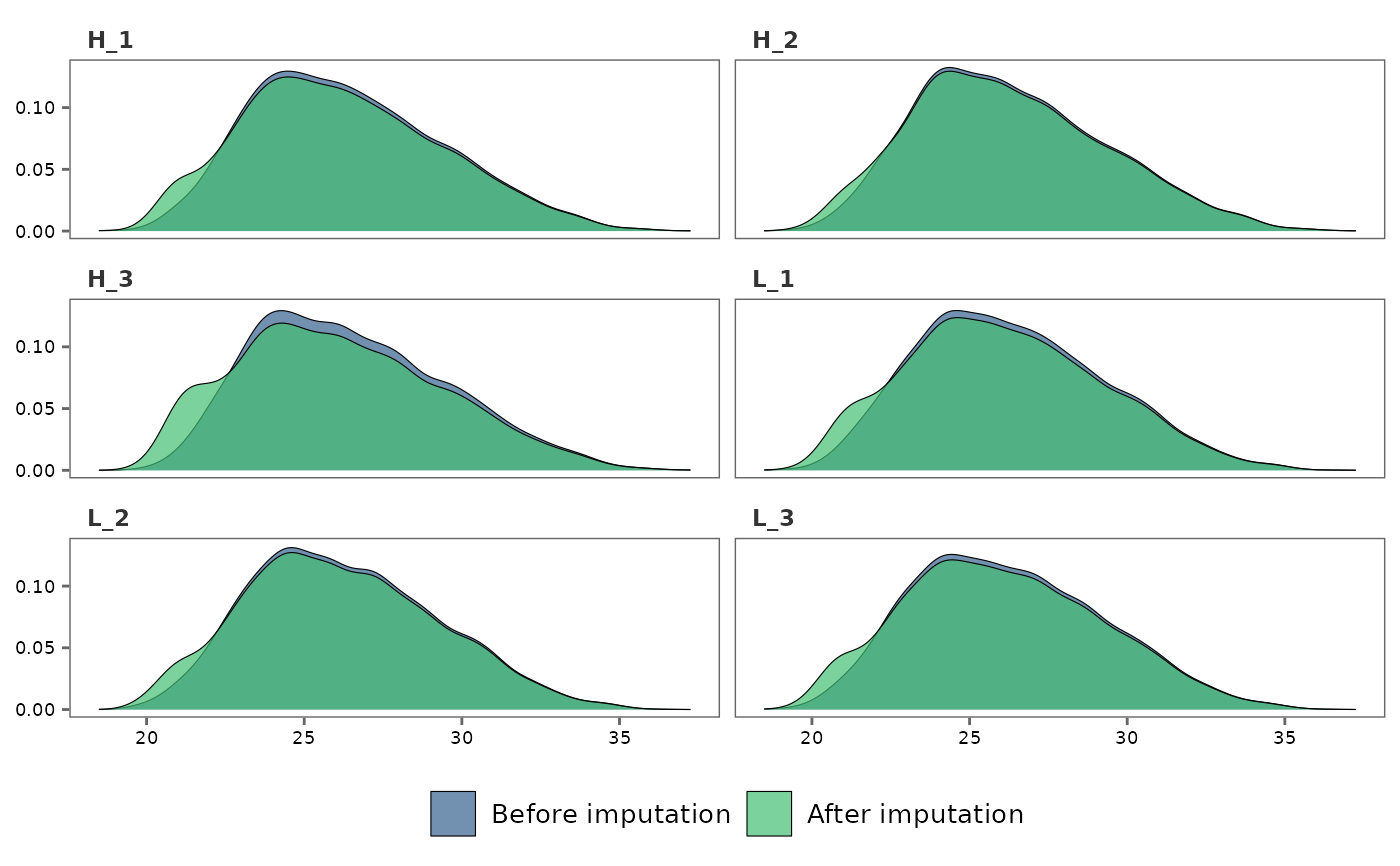
 ## Make sample-wise density plots
impute_plot(raw_df, imp_df, global = FALSE)
#> Warning: Removed 1084 rows containing non-finite outside the scale range
#> (`stat_density()`).
## Make sample-wise density plots
impute_plot(raw_df, imp_df, global = FALSE)
#> Warning: Removed 1084 rows containing non-finite outside the scale range
#> (`stat_density()`).
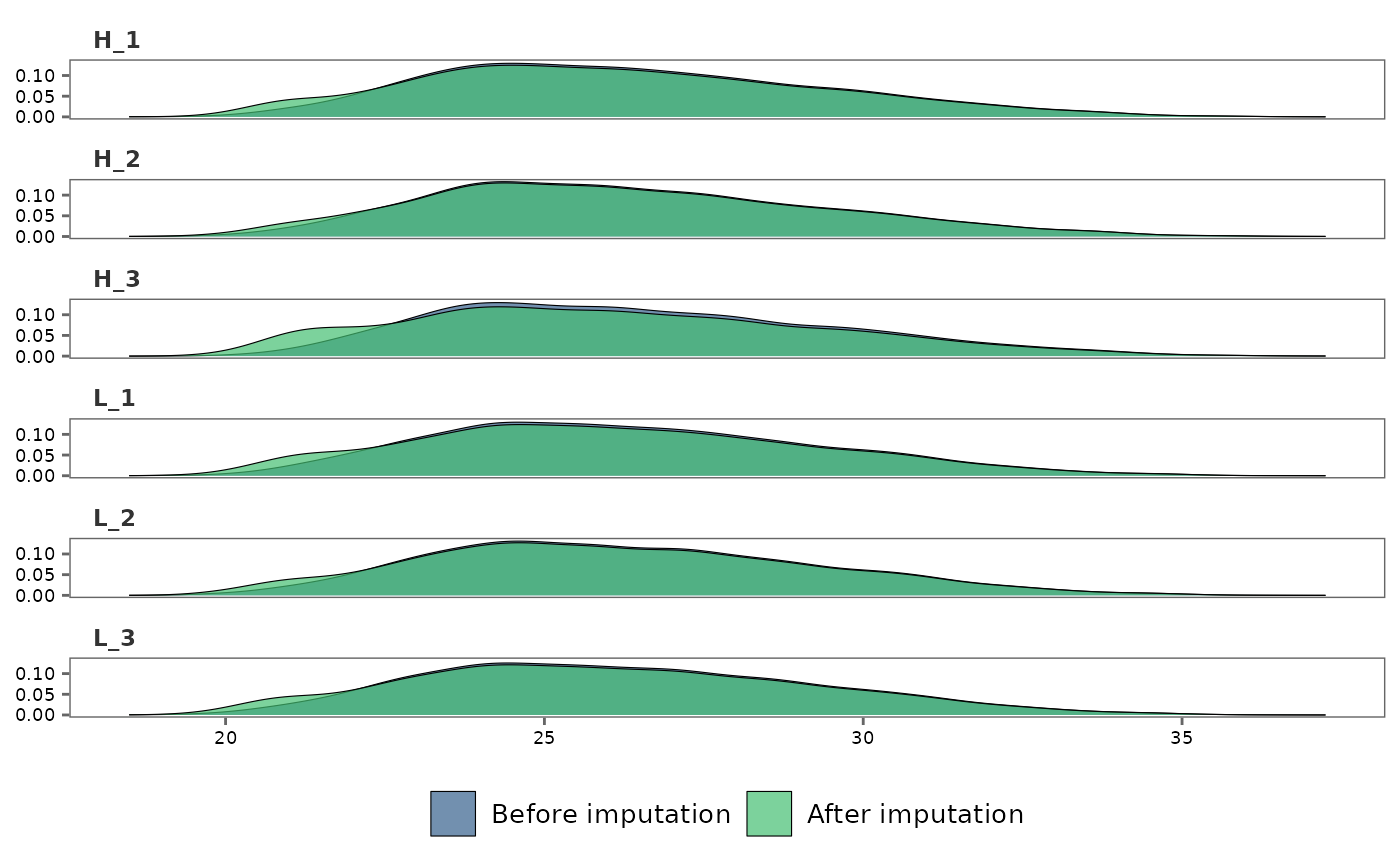 ## Print plots in user-specified numbers of rows and columns
impute_plot(raw_df, imp_df, global = FALSE, n_col = 2, n_row = 3)
#> Warning: Removed 1084 rows containing non-finite outside the scale range
#> (`stat_density()`).
## Print plots in user-specified numbers of rows and columns
impute_plot(raw_df, imp_df, global = FALSE, n_col = 2, n_row = 3)
#> Warning: Removed 1084 rows containing non-finite outside the scale range
#> (`stat_density()`).