This function generates a heatmap to visualize differentially expressed proteins between groups
Usage
heatmap_de(
  fit_df,
  df,
  adj_method = "BH",
  cutoff = 0.05,
  lfc = 1,
  sig = "adjP",
  n_top = 20,
  palette = "viridis",
  text_size = 10,
  save = FALSE,
  file_path = NULL,
  file_name = "HeatmapDE",
  file_type = "pdf",
  dpi = 80,
  plot_height = 7,
  plot_width = 7
)
Arguments
- fit_df
A
fit_dfobject from performingfind_dep.- df
The
norm_dfobject or theimp_dfobject from which thefit_dfobject was obtained.- adj_method
Method used for adjusting the p-values for multiple testing. Default is
"BH".- cutoff
Cutoff value for p-values and adjusted p-values. Default is 0.05.
- lfc
Minimum absolute log2-fold change to use as threshold for differential expression. Default is 1.
- sig
Criteria to denote significance. Choices are
"adjP"(default) for adjusted p-value or"P"for p-value.- n_top
Number of top hits to include in the heat map.
- palette
Viridis color palette option for plots. Default is
"viridis". Seeviridisfor available options.- text_size
Text size for axis text, labels etc.
- save
Logical. If
TRUEsaves a copy of the plot in the directory provided infile_path.- file_path
A string containing the directory path to save the file.
- file_name
File name to save the plot. Default is "HeatmapDE."
- file_type
File type to save the plot. Default is
"pdf".- dpi
Plot resolution. Default is
80.- plot_height
Height of the plot. Default is 7.
- plot_width
Width of the plot. Default is 7.
Details
By default the tiles in the heatmap are reordered by intensity values along both axes (x axis = samples, y axis = proteins).
Examples
## Build a heatmap of differentially expressed proteins using the provided
## example fit_df and norm_df data objects
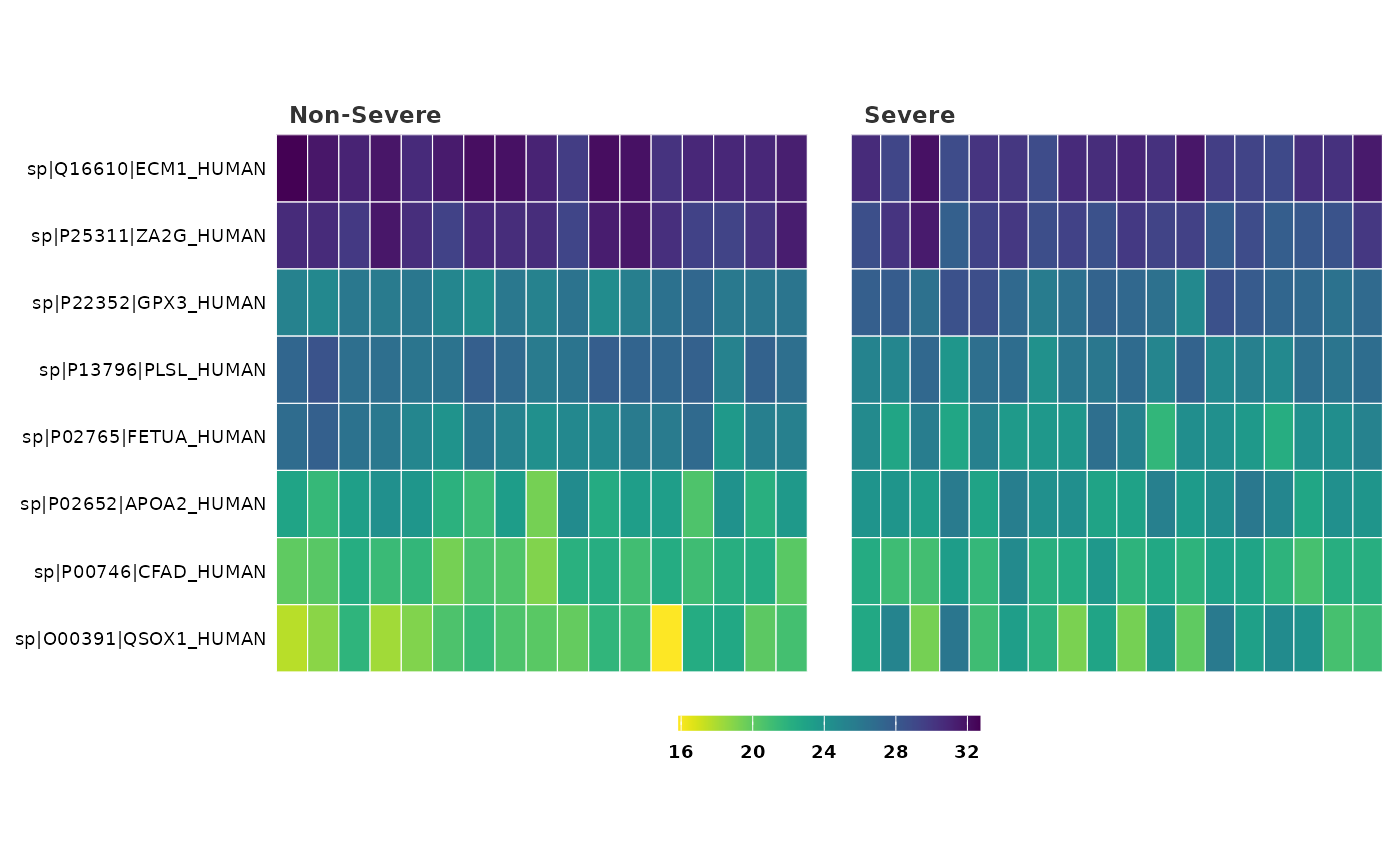
heatmap_de(covid_fit_df, covid_norm_df)
#> Warning: Using `size` aesthetic for lines was deprecated in ggplot2 3.4.0.
#> ℹ Please use `linewidth` instead.
#> ℹ The deprecated feature was likely used in the promor package.
#> Please report the issue at <https://github.com/caranathunge/promor/issues>.
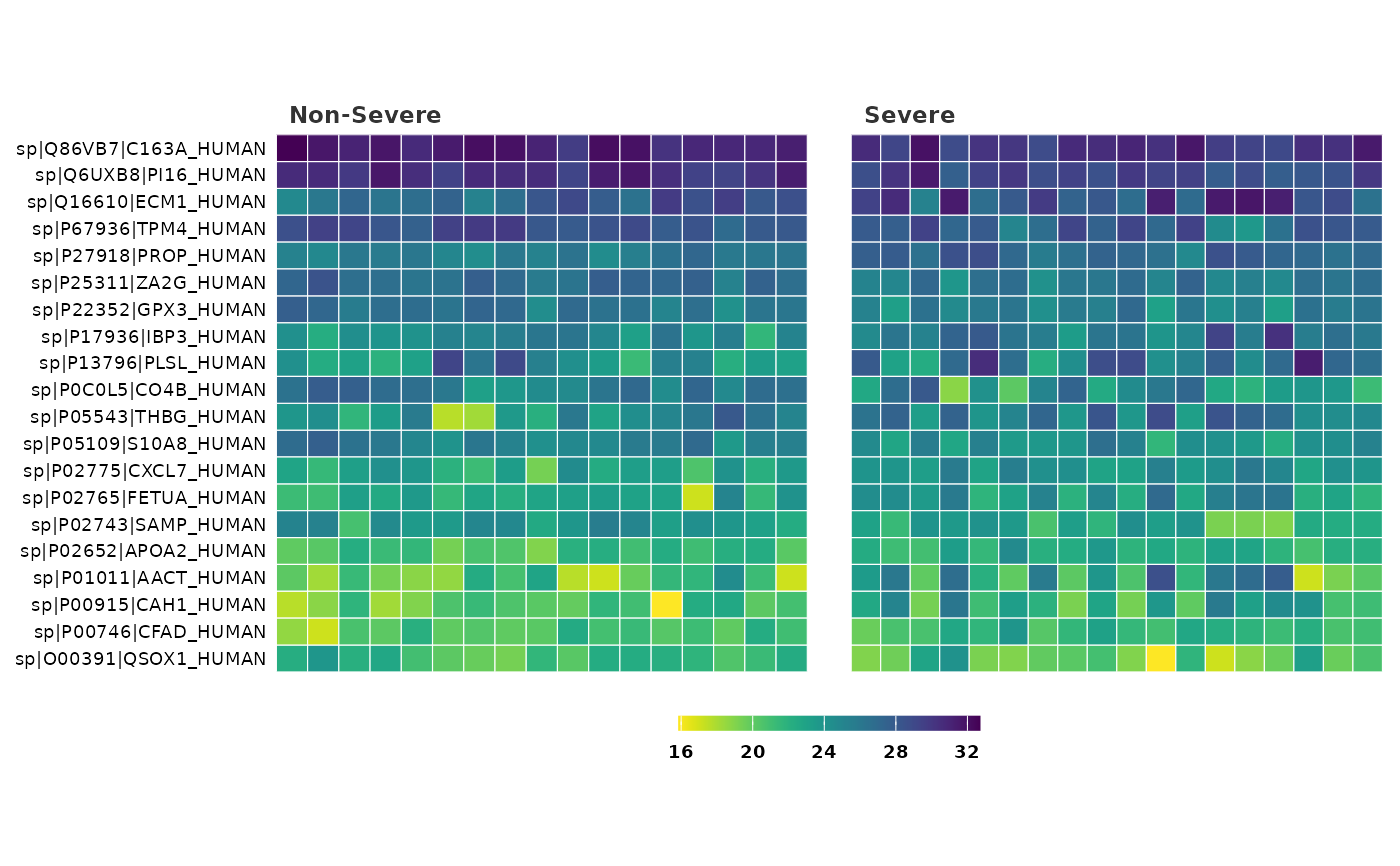
 ## Create a heatmap with P-value of 0.05 and log fold change of 1 as
## significance criteria.
heatmap_de(covid_fit_df, covid_norm_df, cutoff = 0.05, sig = "P")
## Create a heatmap with P-value of 0.05 and log fold change of 1 as
## significance criteria.
heatmap_de(covid_fit_df, covid_norm_df, cutoff = 0.05, sig = "P")
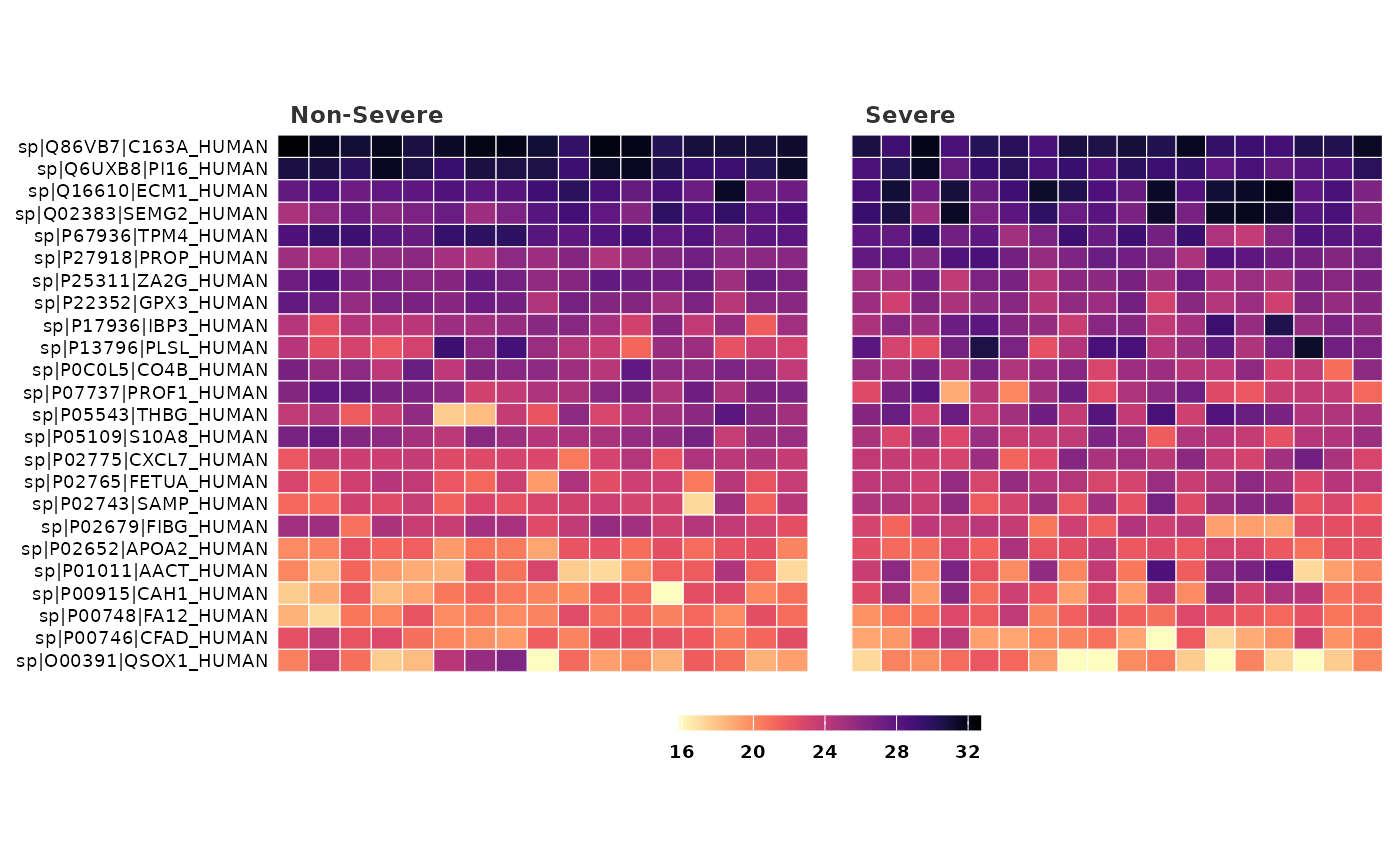
 ## Visualize the top 30 differentially expressed proteins in the heatmap and
## change the color palette
heatmap_de(covid_fit_df, covid_norm_df,
cutoff = 0.05, sig = "P", n_top = 30,
palette = "magma"
)
## Visualize the top 30 differentially expressed proteins in the heatmap and
## change the color palette
heatmap_de(covid_fit_df, covid_norm_df,
cutoff = 0.05, sig = "P", n_top = 30,
palette = "magma"
)